


In this data study, Ridder Law LLC examined every reported intersection crash in Colorado over nearly four years to identify where drivers, cyclists, and pedestrians face the greatest risk of serious injury. The analysis includes the full years of 2022, 2023, and 2024, along with crashes reported from January through November 24, 2025. We calculated a Danger Score for each intersection that prioritizes crash severity over minor collisions, allowing us to identify the locations where crashes are most likely to result in life altering or fatal outcomes.
Key Takeaways
- Aurora has the highest number of dangerous intersections: Nearly half of Colorado’s 50 most dangerous intersections are located in Aurora. These intersections alone accounted for 1357 injuries, more than Denver and Colorado Springs combined within the Top 50.
- Impaired driving leads to more severe injuries: Crashes involving alcohol show a substantially higher share of serious and fatal outcomes, with nearly one in three alcohol-related intersection crashes resulting in a serious injury or death.
- Speed makes crashes more dangerous: As speed limits increase, the likelihood of a fatal crash rises sharply. Intersections with speed limits of 65 mph or higher were far more likely to see fatal crashes than those with lower posted speeds, showing how quickly mistakes become deadly at higher speeds.
- Pedestrians face the greatest risk: Rear-end and parked motor vehicle crashes happen often and usually do not result in fatalities. Pedestrian crashes are very different. Over 50% of crashes involving pedestrians at intersections resulted in serious injury or death.
- Nighttime crashes are more severe: Crashes that occur at night are more likely to be fatal or result in severe injuries than crashes during the day. Even with street lighting, reduced visibility at night increases the risk of severe outcomes for everyone involved.
Which Cities Have the Most Dangerous Intersections?
When we group the Top 50 most dangerous intersections, a stark pattern emerges. Aurora heavily leads in the most dangerous intersections.
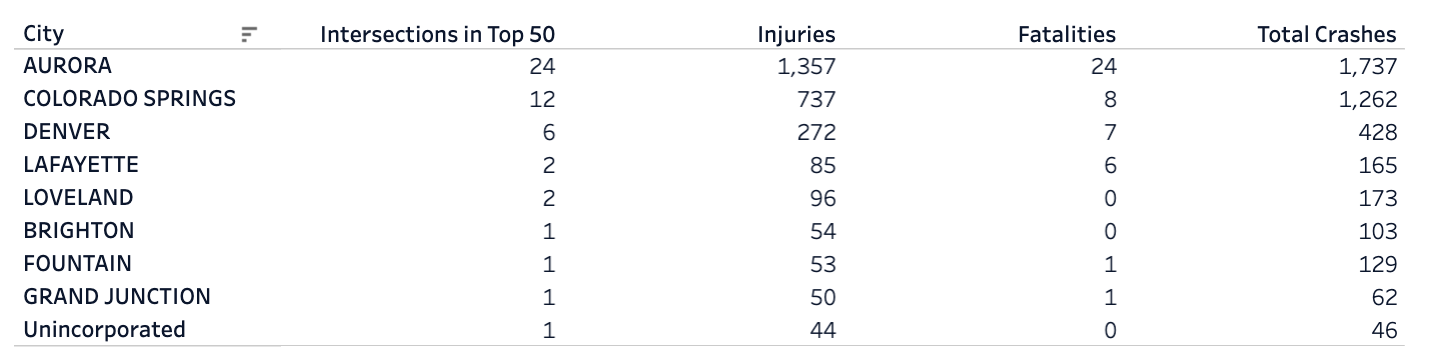
Aurora accounts for nearly half (24) of the state’s 50 most dangerous intersections. This concentration suggests that the risk is structural. Many of Aurora’s most dangerous intersections are located on massive, multiple lane roads like Havana Street, Colfax Avenue, and Mississippi Avenue. These roads prioritize high speed vehicle throughput but feature complex conflict points with turning traffic and pedestrians.
The data indicates that while crashes happen everywhere, Aurora’s intersections facilitate higher speed, higher energy collisions than the more congested, lower speed intersections often found in Denver.
Aurora’s Persistent Struggle: A Year Over Year Analysis
Because Aurora dominates the statewide rankings, we conducted a specific trend analysis on fatal crashes within the city to see if safety is improving.
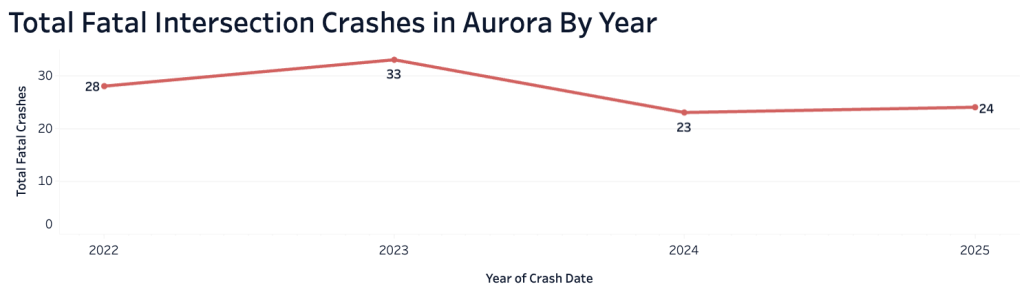
Trend Analysis:
- 2022 (28 Fatalities): Established a high baseline for intersection fatalities.
- 2023 (33 Fatalities): The deadliest year in the study, indicating a spike in severe outcomes.
- 2024 (23 Fatalities): A noticeable dip, potentially linked to enforcement or infrastructure adjustments.
- 2025 (24 Fatalities – Annualized): The data suggests a rebound in fatalities. Despite the dip in 2024, the trend line has not successfully broken significantly below the 2022 baseline.
The Top 50 List: Pinpointing the Risk
To determine which intersections are the most hazardous, we calculated a Danger Score. We weighted heavier to account for fatal or serious injuries to find the most dangerous intersections.
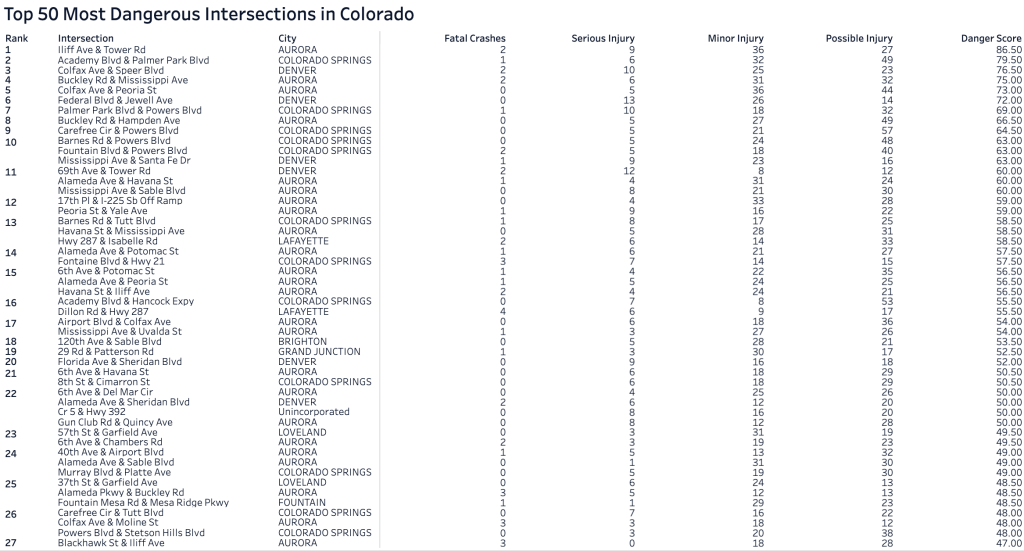
#1 Illiff Ave & Tower Rd
When you look at the Top 50 most dangerous intersections across Colorado, one thing becomes clear: these crashes aren’t random. They tend to happen at busy intersections where fast-moving traffic, frequent turns, and high volumes of people all collide in the same space.
Many of these intersections sit along major arterial roads that drivers use every day to get to work, school, or run errands. Because so many vehicles move through these areas, even small mistakes or momentary lapses in attention can quickly turn into serious crashes.
The list also shows that dangerous intersections aren’t limited to city centers. Suburban intersections appear just as often, especially in places where wide roadways, higher speeds, and limited pedestrian protections create additional risk. These are the kinds of intersections people cross on foot, bike through, or drive every day, often without realizing how dangerous they can be.
Ultimately, the Top 50 isn’t just a ranking it’s a way to focus attention on places where changes could save lives. Improving signals, slowing traffic, and making crossings safer at these intersections has the potential to prevent the most severe outcomes. As safety projects move forward, these locations will be important to watch to see whether real-world improvements translate into fewer serious and fatal crashes.
Importantly, these risks are not going unnoticed. State and local agencies have identified Federal Boulevard as a priority safety corridor and are taking steps to address its most dangerous intersections. Denver City Council approved funding from the Colorado Department of Transportation (CDOT) to install new traffic signals and pedestrian safety upgrades at this intersection and others along Federal Boulevard. Construction is scheduled to be completed between December 2025 and January 2026 and includes upgraded signals, improved pedestrian crossings, and ADA enhancements. As these projects move forward, Federal Boulevard will be an important corridor to watch to assess whether targeted infrastructure improvements reduce the frequency and severity of intersection crashes.
The Most Dangerous Intersections is a Statewide Issue not Just Aurora, and Denver Surrounding Areas
Multiple intersections along Highway 287, particularly in Lafayette and nearby unincorporated areas, appear on the list. These locations reinforce a consistent trend: intersections where highway speed traffic meets local roads are among the most dangerous roadway designs in Colorado. High speeds, wide crossings, and complex turning movements often combined with limited pedestrian protections create conditions where crashes are more likely to result in serious injury or death.
Together, these findings suggest that intersection design, traffic speed, and pedestrian exposure play a critical role in crash severity, and that targeted infrastructure improvements may offer meaningful opportunities to reduce risk at Colorado’s most dangerous intersections.
The Role of Substance Use: Alcohol vs. Marijuana vs. Sober
One of the most revealing parts of our study is the breakdown of injury severity by substance involvement.
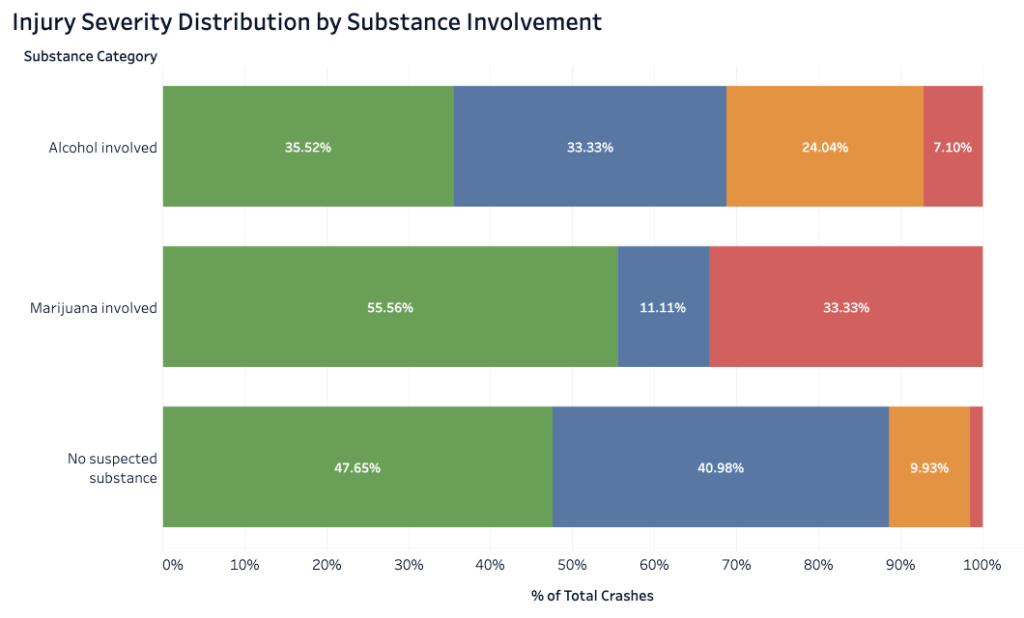
- Alcohol: Alcohol involved crashes are catastrophic. 24.04% result in serious injury and 7.10% in death.
- Marijuana: While fewer total crashes involve marijuana compared to alcohol, those that do occur are incredibly dangerous. The data shows a shocking 33.33% fatality rate in the subset of marijuana involved intersection crashes recorded.
- Sober Drivers: By contrast, crashes with no suspected substance use are overwhelmingly survivable and minor injuries. 87% of these incidents result in only minor or possible injuries, proving that sobriety allows for reaction times that can mitigate the severity of a crash even if it cannot prevent it entirely.
Behavioral Causes Leading to Intersection Crashes
We analyzed the “Primary Cause” cited in police reports to understand the human behaviors driving these statistics.
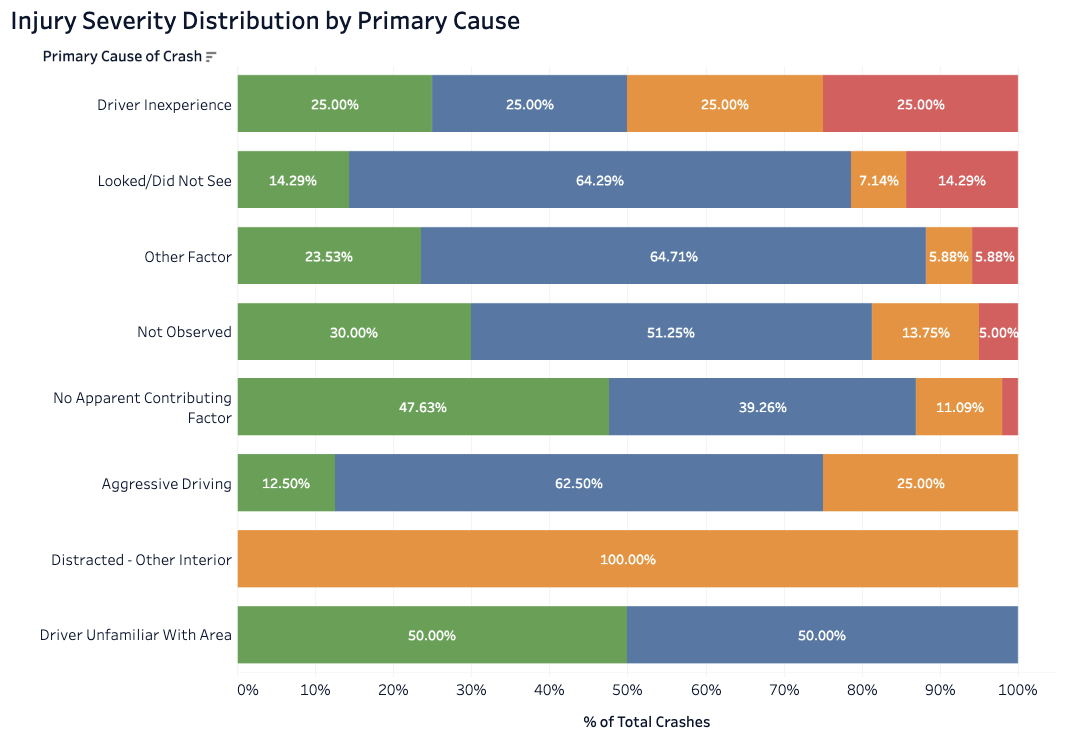
- Driver Inexperience: This category has the highest correlation with fatality (25% of recorded crashes were fatal). New drivers may lack the judgment to execute complex left turns against traffic or judge gaps in high speeds.
- Looked/Did Not See: 1 in 7 looked and did not see driving crashes at these intersections results in death.
Crash Type and Injury Severity
The type of crash dictates the medical outcome. This chart visualizes the extreme vulnerability of pedestrians and cyclists compared to vehicle occupants.
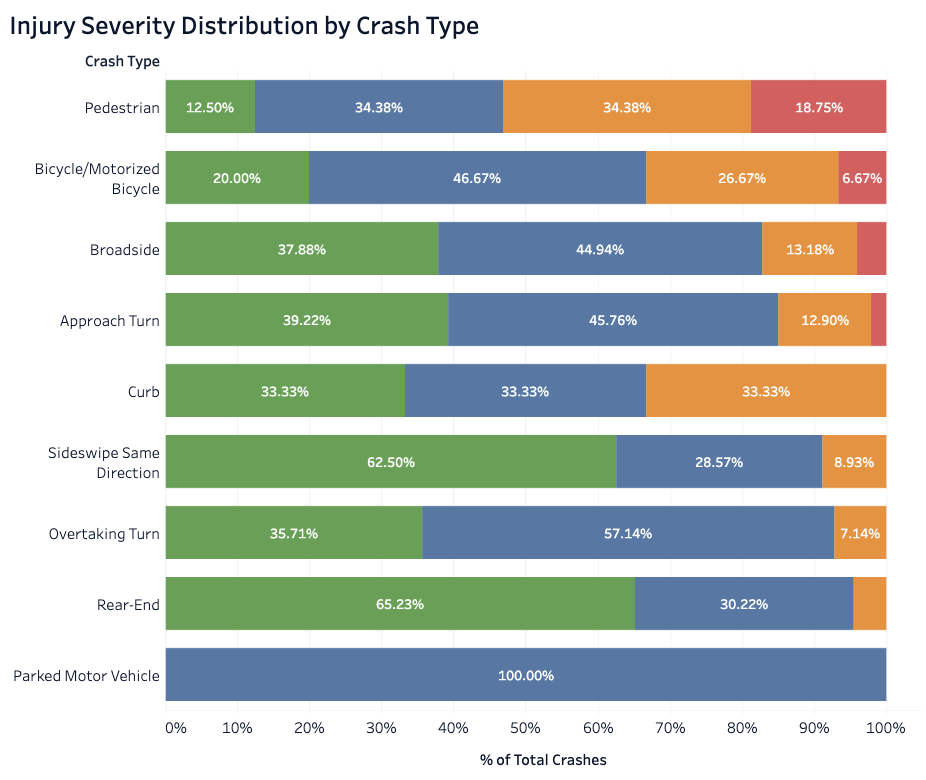
- Pedestrian crashes are the most dangerous intersection crash type, with the highest share of serious and fatal injuries, showing how exposed pedestrians are in crossing environments.
- Bicycle and motorized bicycle crashes also have a high severity rate, with a meaningful portion resulting in serious or fatal injuries, especially when interacting with turning vehicles.
- Broadside (T-bone) crashes remain among the most severe vehicle to vehicle collisions, frequently resulting in serious injuries or fatalities due to the lack of side protection.
- Approach turn crashes present elevated risk, as turning movements increase conflict points and lead to a notable share of serious and fatal outcomes.
How Lighting Impacts Injury Severity
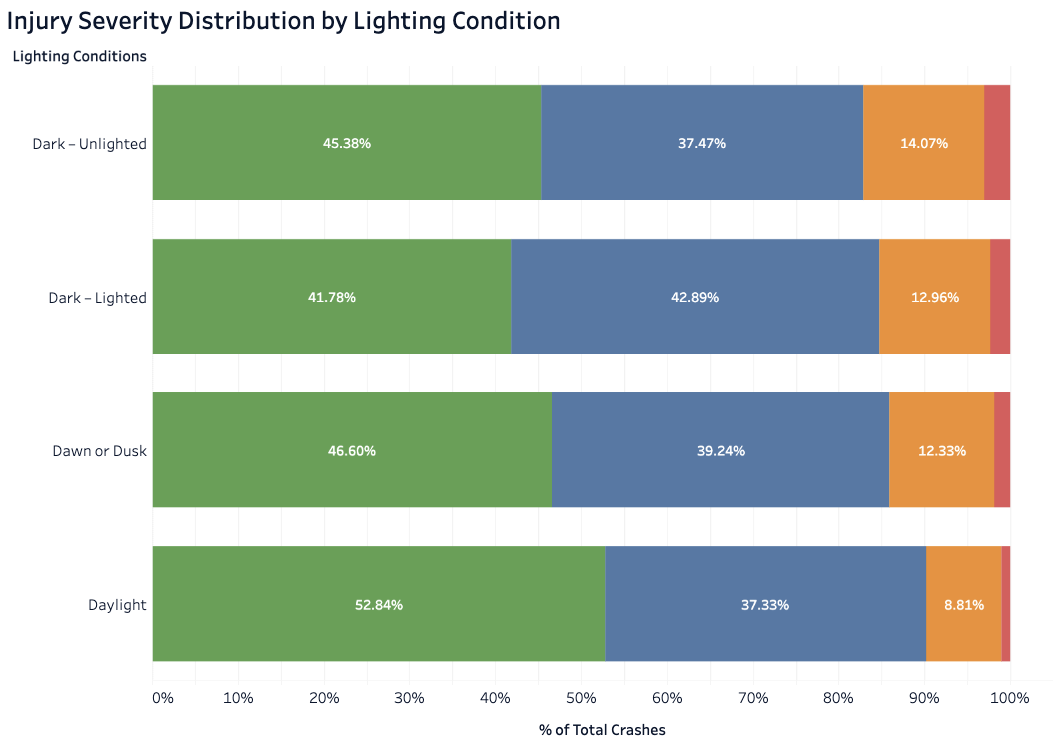
The Darkness Factor: Fatal crashes occur at a rate of 1.03% in daylight, but rise sharply at night. In dark, unlighted conditions, the fatality rate increases to 3.08%, while dark but lighted intersections still see a high 2.37% fatality rate. The small difference suggests that current intersection lighting may not be sufficient to offset the visibility challenges of nighttime driving, especially for pedestrians and cyclists.
How Speed Impact Fatal Crashes
Crash data shows the relationship between vehicle speed and fatal outcomes at intersections. When speeds are below 45 mph, fatality rates remain relatively low, generally between 1% and 4%. While crashes at these speeds are still dangerous, there is at least some margin for drivers and pedestrians to react and survive.
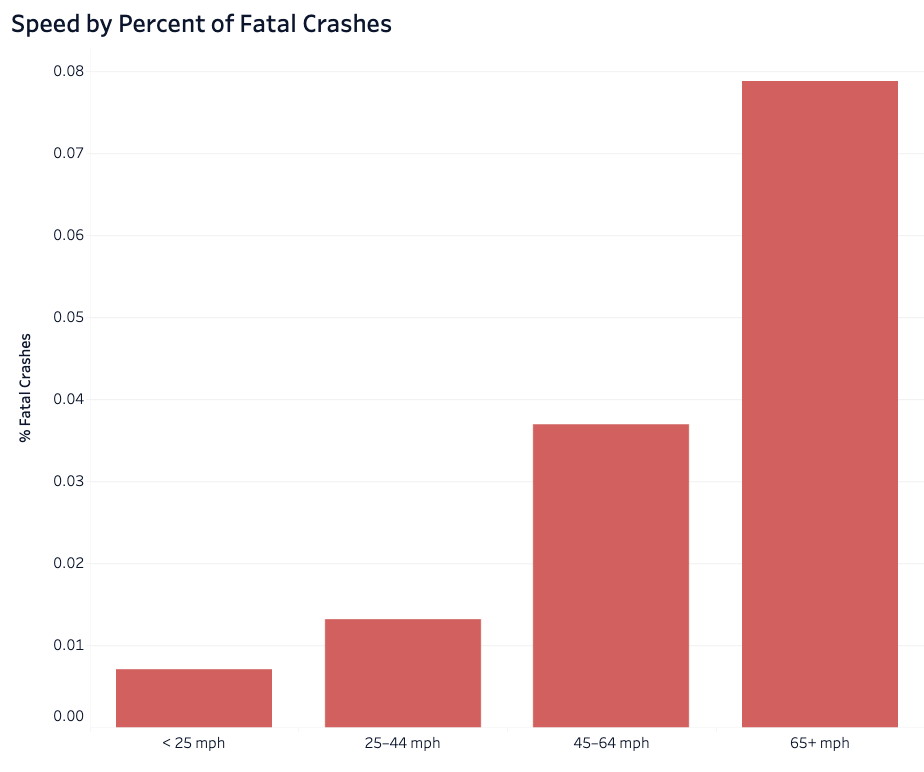
That margin disappears at higher speeds. When vehicle speeds reach 65 mph or higher, the fatality rate jumps to 7.9%. At these speeds, even a single mistake, missed signals, delayed reactions, or unexpected cross-traffic can have catastrophic consequences.
This sharp increase strongly suggests that intersections controlled by stoplights or stop signs are fundamentally incompatible with highway speeds. When fast vehicles interact with crossing or turning traffic, the forces involved leave virtually no room for error, making severe and fatal crashes far more likely.
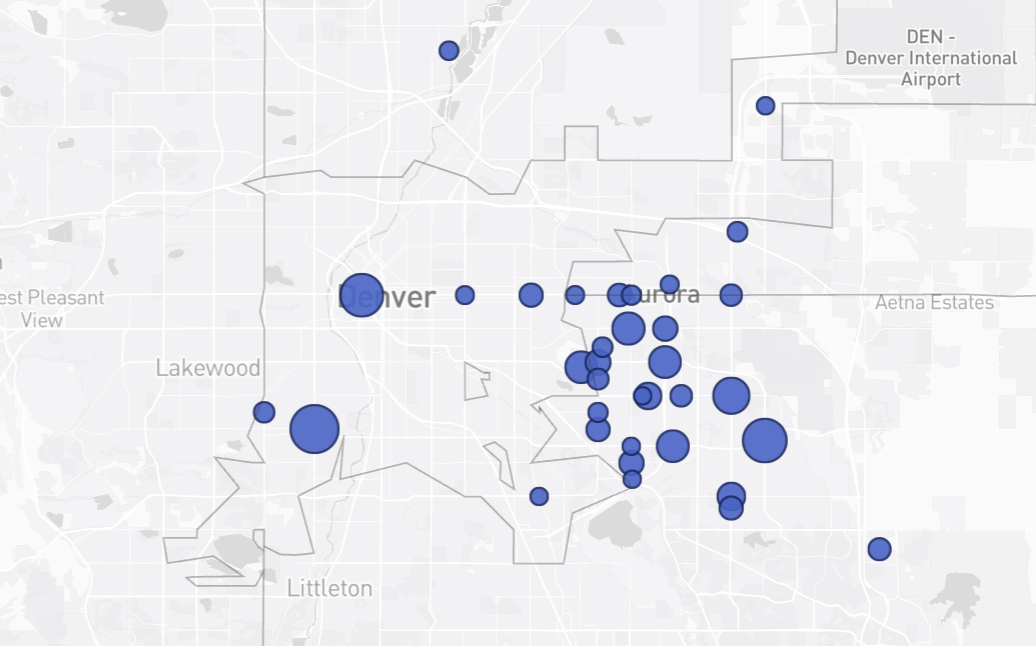
Visualizing the 50 Most Dangerous Intersection Crash Hotspots
The map shows the locations of Colorado’s 50 most dangerous intersections. High risk intersections are concentrated in the Denver metro area, with a particularly dense cluster in Aurora. Additional hotspots appear in Colorado Springs reflecting the elevated crash risk associated with high volume, high speed urban road networks.
Steps for Colorado to Take Moving Forward
Intersections remain some of the most dangerous locations on Colorado’s roadways, particularly where high speeds, wide crossings, and heavy pedestrian activity converge. This study shows that serious and fatal crashes are most likely at intersections designed to move traffic quickly rather than safely, leaving little margin for driver error and placing pedestrians and cyclists at the greatest risk.
The data highlights a clear need to rethink how high-risk intersections are designed and managed. Wide, multi-lane arterials with complex turning movements consistently appear among the most dangerous locations, especially where pedestrian protections are limited or crossings require navigating long distances across fast-moving traffic.
Targeted infrastructure improvements such as updated signal timing, improved pedestrian crossings, speed management strategies, and clearer lane configurations have the potential to reduce crash severity even if they do not eliminate crashes entirely. However, these improvements must be paired with ongoing evaluation to ensure they are producing measurable safety benefits over time.
Ultimately, improving intersection safety in Colorado will require sustained investment, data-driven decision-making, and a stronger focus on protecting the most vulnerable road users. By prioritizing proven safety interventions at the intersections where crashes are most severe, Colorado can take meaningful steps toward reducing serious injuries and saving lives across the state.
Methodology
This study utilized raw crash data from the Colorado Department of Transportation (CDOT), cleaned and geocoded by 1point21interactive.
- Data Period: January 1, 2022 – November 24, 2025.
- Danger Score Calculation: We did not simply count crashes. We applied a weighted formula:
- Fatality: Highest Weight
- Serious Injury: High Weight
- Minor or Possible Injury: Low Weight
- Property Damage Only: Excluded from the ranking metric to focus on human safety.
- 2025 Projections: To allow for a fair year over year comparison in the Aurora trend analysis, 2025 data was annualized based on the daily crash rate observed through November 24th.
Fair Use Agreement
We hope this research contributes to safer roads in Colorado. You are welcome to use the images, data, and insights from this study for news reports, educational purposes, or social media. We kindly ask that you attribute the work by linking back to this study as the source.
Disclaimer
This content is for informational purposes only. Past crash statistics are not a prediction of future events. Every legal case or traffic engineering study requires an independent evaluation of the specific facts and conditions present at the time.